New
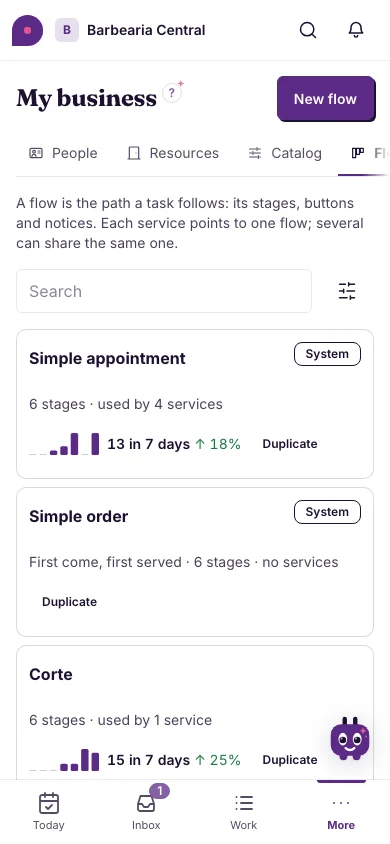
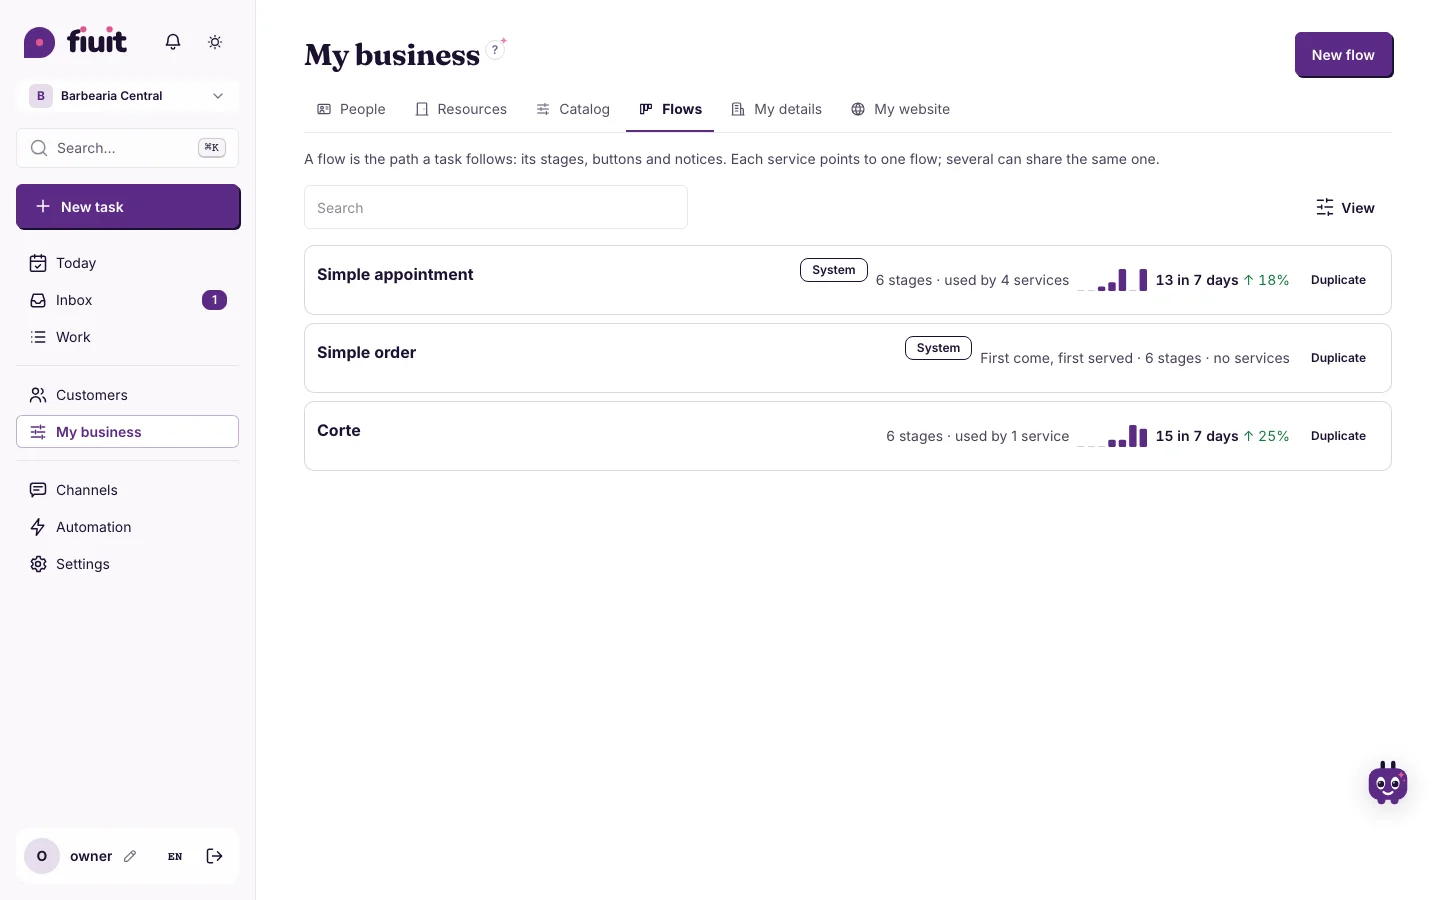
See which workflows your business uses and where they slow down
Each flow shows how many jobs come in per day and which stage they wait longest in, so you know where to improve.
What you get
- Know what's used most: each workflow shows last week's activity and whether it's going up or down.
- See where things slow down: the stage where jobs wait longest is highlighted.
- From the number to the work: from any day you get to the jobs that came in that day.